Cheat Sheet: Account Executive Metrics [Infographic]
When you’re coaching account executives, you can only give so much advice at once. You can’t have every rep focus on improving everything all at the same time.
Instead, you need to pick your spots, and have reps focus on a manageable amount of stuff at a time. This allows them to practice that skill deliberately, and improve to being great at it. After they master one part of the process, they can move on to the next.
To that end, we’ve created a cheat sheet of metrics that you can use to diagnose where AE’s need coaching. The metrics are broken into top, middle, and bottom of the funnel. Each metric comes with a formula, so you can calculate it with your own Salesforce or HubSpot CRM data.
Get the cheat sheet by clicking through below! If you’re looking for even more metrics, check out our sales metrics glossary, which has KPIs you can use for AEs, BDRs, Account Managers, Customer Success Reps and more.

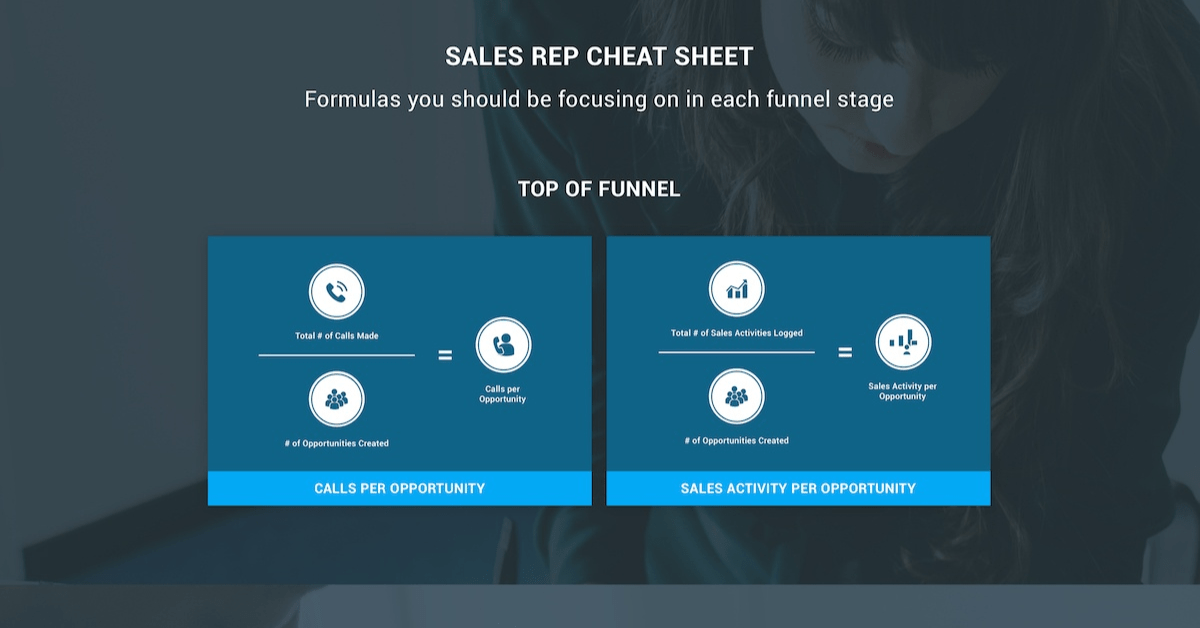
Top of Funnel AE Metrics
At the top of the funnel, you want to look at how efficient your AEs are at generating opportunities. A couple of good metrics here are:
- Calls per Opportunity: Measures how many calls it takes for an AE to generate an opp. Lower numbers are generally better, as that means the rep is being efficient with their calls.
- Sales Activity per Opportunity: Measures how many total activities it takes for an AE to generate an opp. Lower numbers are generally better, as that means the rep is being efficient with their calls, emails and other activities.
Middle of Funnel AE Metrics
In the middle of the funnel, you should be focused on how opportunities are progressing and moving forward. You also should make sure that AEs have enough pipeline to hit their targets. If they don’t, you need to intervene and have them focus on pipeline generation. Recommended metrics to track in the middle of the funnel are:
- Forecast Coverage: Tracks each AE’s weighted projection, compared to their quota. If you are accurate with your forecast and stages, then this tells you whether the rep is on track to hit their goal.
- Pipeline Coverage: Tracks how much pipeline each AE has, compared to how much quota they have left. Rule of thumb is to have 3-4x pipeline coverage so that if reps close 25-30% of their pipeline, they will hit target.
- Stage Conversion Rate: Tracks the percentage conversion rate of each opp from each stage to the next. Helps identify whether there is a particular stage where the rep’s opps tend to get stuck.
- Stage to Stage Duration: Tracks how long it takes for opps to get to one stage to the next. Similar to stage conversion, but tells you if opps are getting bogged down for longer than they should.
- Sales Velocity: This is a super-metric that takes (Opps Created x Close Rate x ASP) / Win Rate. This will tell you that if a rep converts their new opps at historical rates, ASP and cycle, what their production on the most recent batch of opps will be.
- Sales Velocity per Opp: Very similar to above, but it factors out how many opps were created. So this is telling you how effective each AE is with their opps.
- Opportunity Push Rate: Measures the percentage of opps that end up pushing out to a future period. This tells you whether your AEs are carrying healthy pipeline, or if they keep bumping out the same opps into the future, which will give them a large, but unhealthy pipeline.
Bottom of Funnel AE Metrics
At the bottom of the funnel, you’re measuring how effective your AEs are. You should look at how they have done against targets, and how they’ve been able to move deals through the process. Here are great metrics to look at for your AEs at the bottom of the funnel:
- Quota Attainment: This is a simple one that tracks what percentage of quota each rep hit. Having clear goals and holding reps accountable to that is important. Likely this metric will be tied to compensation.
- Sales Cycle: Use this to assess whether reps are getting opps through the process quickly, or if they’re getting bogged down.
- Opportunity Win Rate: Use this to assess whether a rep has opened quality opps and if they are able to get them to close.
- Average Selling Price (ASP): Tracks the average size of the deals each rep is doing. Useful for assessing whether a rep is spending their time on opps that are valuable enough. Beware as well of reps whose ASP is too high — make sure they are able to put through enough volume of deals to hit their targets, rather than just whale hunting and having dry spells if the couple big opps don’t close.
- Value per Opportunity: Multiplies your win rate by ASP. Tells you how much an average opp is worth for each rep.
Learn More
Sales scorecards calculate all of these metrics and more for your AEs, automatically. Scorecards are designed to give sales managers context into how reps are performing, by benchmarking reps on important KPIs, trending performance over time, and tracking progress against goals.