Everything you need to know about Pipeline Coverage

Pipeline coverage is a ratio used by sales managers to measure how much pipeline they have, compared to how much quota they need to close. It’s calculated by dividing your open pipeline by how much quota you need to close. General rule of thumb is to have 3x to 4x pipeline coverage. This means you want to have 3 to 4 times more pipeline than quota.
But there’s a lot more to it than just that. This post breaks down pipeline coverage, how it’s calculated, how it’s used, and some best practices for how to manage it in your sales team.
Calculating Pipeline Coverage
To calculate pipeline coverage, you just divide the amount of open pipeline you have, which is set to close in the period you’re measuring, by the quota you have for that same period. Read this article for more details on how to calculate pipeline coverage using data from Salesforce or HubSpot CRM.
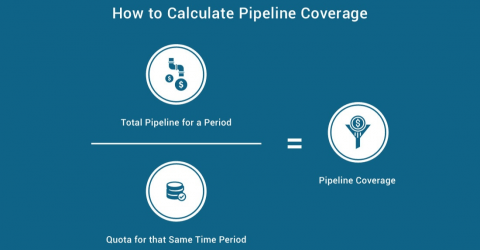
As an example, if your remaining quota for Q1 is $500,000 and you have $1,500,000 of open pipeline for Q1, then your pipeline coverage would be $1,500,000 / $500,000 = 3x.
What should your Pipeline Coverage Ratio be?
Many people just go by rule-of-thumb on this. If you ask a bunch of sales VP’s, most will suggest you should aim for 4x or 3x pipeline coverage. Those answers are actually pretty good, for the most part. But why? And, is there a more accurate way to tell what your pipeline coverage ratio should be?
To answer the question, let’s first think about what it represents. It’s a ratio of how much open pipeline you have per quota that you have remaining to close. You want to make sure you have enough pipeline to hit your quota, knowing that you’re not going to win every deal in the pipeline. That’s why you definitely don’t want 1x pipeline. If you only have 1 dollar of pipeline for every dollar of quota you need to hit, then you’d need to close every single deal in the pipe to make your number.
To figure out what your pipeline coverage ratio should be, you need to know your average win rate. This is just the total amount of bookings you close, per dollar of pipeline you open. Or you could measure it as the number of deals you close divided by the number of opportunities you create.
Once you have a handle on your win rates, you can be smart about what type of pipeline coverage to aim for. The math is just 1 divided by your win rate. Meaning if you have a 25% win rate, then you should aim for 1 / .25 = 4x pipeline coverage. If your win rate is 25%, that means you’re winning 1 out of every 4 opps. So you want to make sure you have 4 opps in the pipeline for every opp you need to win. Or, 4 dollars of pipeline for every dollar of quota you need to close.
The reason that the rule-of-thumb numbers of 3x and 4x pipeline coverage generally work well is simply because most companies have win rates in the ballpark of 25% to 33%.
How is Forecast Coverage different?
Forecast coverage is similar to pipeline coverage, but a little more nuanced.
Where pipeline coverage just looks at all open pipeline compared to quota, forecast coverage takes your forecast categories into account to produce a weighted pipeline number, which is compared to quota. Typically, you display forecast coverage as a percentage instead of a ratio.
As an example, let’s say your quota is $1M, your pipeline is $3M and your forecast is for $0.8M. In this case, your pipeline coverage would be 3x quota, and your forecast coverage would be 80% of quota. This article has more information on how to calculate forecast coverage using Salesforce or HubSpot CRM data.
Forecast coverage is very valuable when you are more than halfway through the period you’re measuring. By the halfway point, your opportunities should be spread into different stages, and so weighting your opportunities based on the stage / forecast category is helpful.
But early in the period, or if looking at future periods (like next quarter), pipeline coverage can be more useful because it gives you a general sense of whether or not you have been creating enough pipeline.
Best practice is to track both pipeline coverage and forecast coverage. This is because pipeline coverage tells you more about how much pipeline you’ve been creating, and forecast coverage gives better information about how far through your process your pipeline is making it.
How to use Pipeline Coverage as a sales manager
The most productive use is to identify where reps should be focusing their energy.
If a rep has strong pipeline coverage, that means they should be very actively focused in the later parts of the sales process. They need to be working their deals and moving them through the sales process toward closing.
If a rep has weak coverage, that means their energy needs to be directed at the top of the sales funnel. Reps with weak coverage will not be able to hit their quota unless they generate more opportunities. They need to do this early enough in the period so they have enough time to move the new opps through the full sales process.
You should also monitor pipeline coverage on a forward-looking basis. If your sales cycles are quarterly, look at the current and next quarter, or current and next 2 quarters. If your sales cycles are shorter, then you probably only have pipeline that extends out a couple months, so look at the current and next 2 months.
This helps identify reps that have strong near-term pipeline, but have weak pipeline in future periods. When reps end up with weak future pipeline, then generally they will end up hitting an air bubble in their pipeline. This produces a really bad month or quarter.
As a sales manager, you can avoid your reps having bad months and quarters by staying on top of their future pipeline coverage. If future coverage is weak, then be proactive with the rep to make sure they focus on continuing the pace of pipeline generation, even though they might have a lot of deals they are working in the short term.
If you have strong short-term coverage but weak long-term coverage, you might choose to have your marketing and BDR teams focus energy on generating demand, which produces longer-term pipeline. If your longer-term coverage is good, then your marketing and BDR teams can focus more on mid-funnel activities that will drive opportunities forward.
How often to measure Pipeline Coverage
Pipeline coverage can help you and your sales managers assess where they should be spending their time. Because of that, it’s valuable to track it on a regular basis. You should be measuring coverage for both the current and future periods at least every week. Best practice though is for managers to know their coverage on a daily basis.
When large deals come into or out of the pipeline, it can make a big impact on coverage ratios. So, the state of your pipeline at any given time will influence where you want your team to spend their time.
Tools for measuring it
There are a few different approaches for measuring pipeline coverage.
- CRM: Some companies track pipeline coverage in their CRM. To do this, you need to have an object that stores quotas for each period, for each rep. You would then need to run a report that brings in both the quota data as well as the open pipeline for a rep and matches the dates for each, so that you can see it on a per-rep basis. You will also want to structure your report so that you could roll each rep’s coverage up to the team level, and roll teams up to the whole sales org. This is very difficult to do in some CRMs, like Salesforce and HubSpot, because of the way they store data. You would need the report to be cross-object, which those CRMs struggle with.
- Spreadsheets: Because CRMs struggle to calculate pipeline coverage, many companies resort to tracking it in spreadsheets. Spreadsheets can easily handle the calculation. The downside is that the data in spreadsheets grows stale very quickly, and keeping them up to date requires a lot of manual work and time. Additionally, spreadsheets can grow cumbersome if your sales org is large. You might end up with millions of tabs to track your various teams. And if you want to look at coverage over different periods, it’s hard to change date ranges on the fly.
- Sales Scorecards: Applications exist that are designed specifically for tracking KPIs by rep and by team. For instance Brainshark is built to help sales managers to track metrics by rep, like pipeline coverage, using Sales Scorecards. This technology also lets you aggregate coverage up from reps to teams, or to the whole sales org. You can change date ranges on the fly so that it’s easy to look at both current and future coverage. Additionally, this type of application is connected to the CRM and to your other data sources, like Google Sheets, so that you can have both your pipeline numbers and your quota numbers up to date at all times. With sales scorecards, sales managers can keep the pulse of their pipeline on a daily basis.
Get a preview of Scorecards here: